PLATFORM · ENGINEERING ANALYTICS · PHYSICS LAYER

Force. Energy. % rated.
Every fender, every second.

Navitrak's physics engine turns raw laser distance into rated force, energy absorbed, and safety-margin numbers — in real time, per fender, per second of approach. The same numbers an engineering study would compute by hand, generated continuously and stored indefinitely.

§01 / THE PHYSICS ENGINE

What happens, every second.

A laser distance reading arrives at the server. The physics engine looks up the fender's datasheet deflection curve as a runtime model, computes reaction force and energy absorbed, compares to rated capacity, and writes the result to the measurements table. Continuously. Per fender. Per second.

FIG. 1 · FIVE STAGES · ONE PIPELINE engineering framework · per-fender rated-margin policy
01 · SENSOR

Laser + 3D lidar.

Hybrid jetty sensors, Ex 1&2 certified. 480,000 pts/sec scan rate.
Distance · ±1 cm @ 2–350 m Velocity · ±0.5 cm/s
d (m) t (s)
RAW INPUT  ·  FIELD TIER
02 · INGEST

Fused row, per second.

AIS-derived position and lidar/laser-derived position co-located in the same per-second row of the measurements table.
Display rate · 1 Hz (10 Hz capable) Retention · indefinite
t · AIS · v · h t · LIDAR · d · v t+1 · …
SAME ROW  ·  DATA TIER
03 · PHYSICS ENGINE

Datasheet curve as a runtime model.

Manufacturer deflection curve loaded once per fender. Every distance reading produces an instantaneous force estimate scored against rated capacity.
Cadence · per second Scope · per fender Framework · engineering guidance + site mooring policy
ILLUSTRATIVE EXAMPLE
% RATED F (kN) δ (mm)
RUNTIME · PER FENDER · PER SECOND
04 · METRICS

Force. Energy. % rated.

Three engineering numbers, written to the measurements table on every cycle. The same numbers a hand-calculated berth engineering guidance study produces — generated automatically.
Reaction · F (kN) Energy · E (kN·m) Rated margin · % RATED
ILLUSTRATIVE EXAMPLE
F 4 380 kN E 2 110 kN·m % RATED 73 %
OUTPUT · EVERY CYCLE
05 · DECISION

Where it lands.

Three decision surfaces an operator actually uses. Same data; three latencies.
Real-time · Alert (workflow-fired) Just-after · Operation Report PDF Anytime · Operator Assistant (NL query)
ALERT workflow 25 parts REPORT PDF audit-grade ASSISTANT NL query historical
SURFACE TIER  ·  3 TARGETS
  Five stages, one pipeline.    Sensor specs from brief/02-product.md: distance ±1 cm @ 2–350 m, velocity ±0.5 cm/s, sensor scan rate 480 000 pts/sec.    Illustrative example values shown inside the stage cards (F, E, % rated) — not customer data.    Engineering traceability: stages 03–04 persist per-fender model output and rated-margin evidence.
§02 / PER-EVENT EVIDENCE

Per-fender, per-event. In every Operation Report.

Every berthing produces an audit-grade Operation Report PDF. The fender-performance table is the engineering centerpiece: peak deflection, reaction force, energy absorbed, and % rated for every fender involved in contact. The same rated-margin number a hand-calculated berthing study produces — generated automatically.

# Fender · Model Peak δ Reaction F Energy E % Rated
F1 DIVM 2000H × 2500L End fender 412mm 4 380kN 2 110kN·m 73 %
F2 DIVM 2000H × 1500L Middle fender 478mm 3 940kN 1 920kN·m 81 %
F3 DIVM 2000H × 1500L Middle fender 505mm 4 120kN 2 040kN·m 87 %
F4 DIVM 2000H × 1500L Middle fender 462mm 3 820kN 1 870kN·m 78 %
F5 DIVM 2000H × 1500L Middle fender 428mm 3 660kN 1 760kN·m 75 %
F6 DIVM 2000H × 2500L End fender 395mm 4 240kN 2 050kN·m 70 %

FIG. 2.1 · Illustrative example values — not customer data. Every number in the F1–F6 rows above (deflection, reaction force, energy absorbed, % rated) is a synthesised example chosen to exercise the table's threshold colouring; none of it is from a real berthing. Fender model names (DIVM 2000H × 2500L, etc.) are illustrative manufacturer datasheet examples. Berth engineering guidance nominal thresholds used for the chip colouring: ok ≤ 80 %; warn 80–85 %; over > 85 %.

§03 / AGGREGATE FENDER ANALYTICS

Months of data. One dashboard.

The Aggregate Fender Analytics dashboard rolls up every berthing the physics engine has scored into a berth engineering guidance-aligned safety scorecard. The engine computes; the history stores, aggregates, and queries.

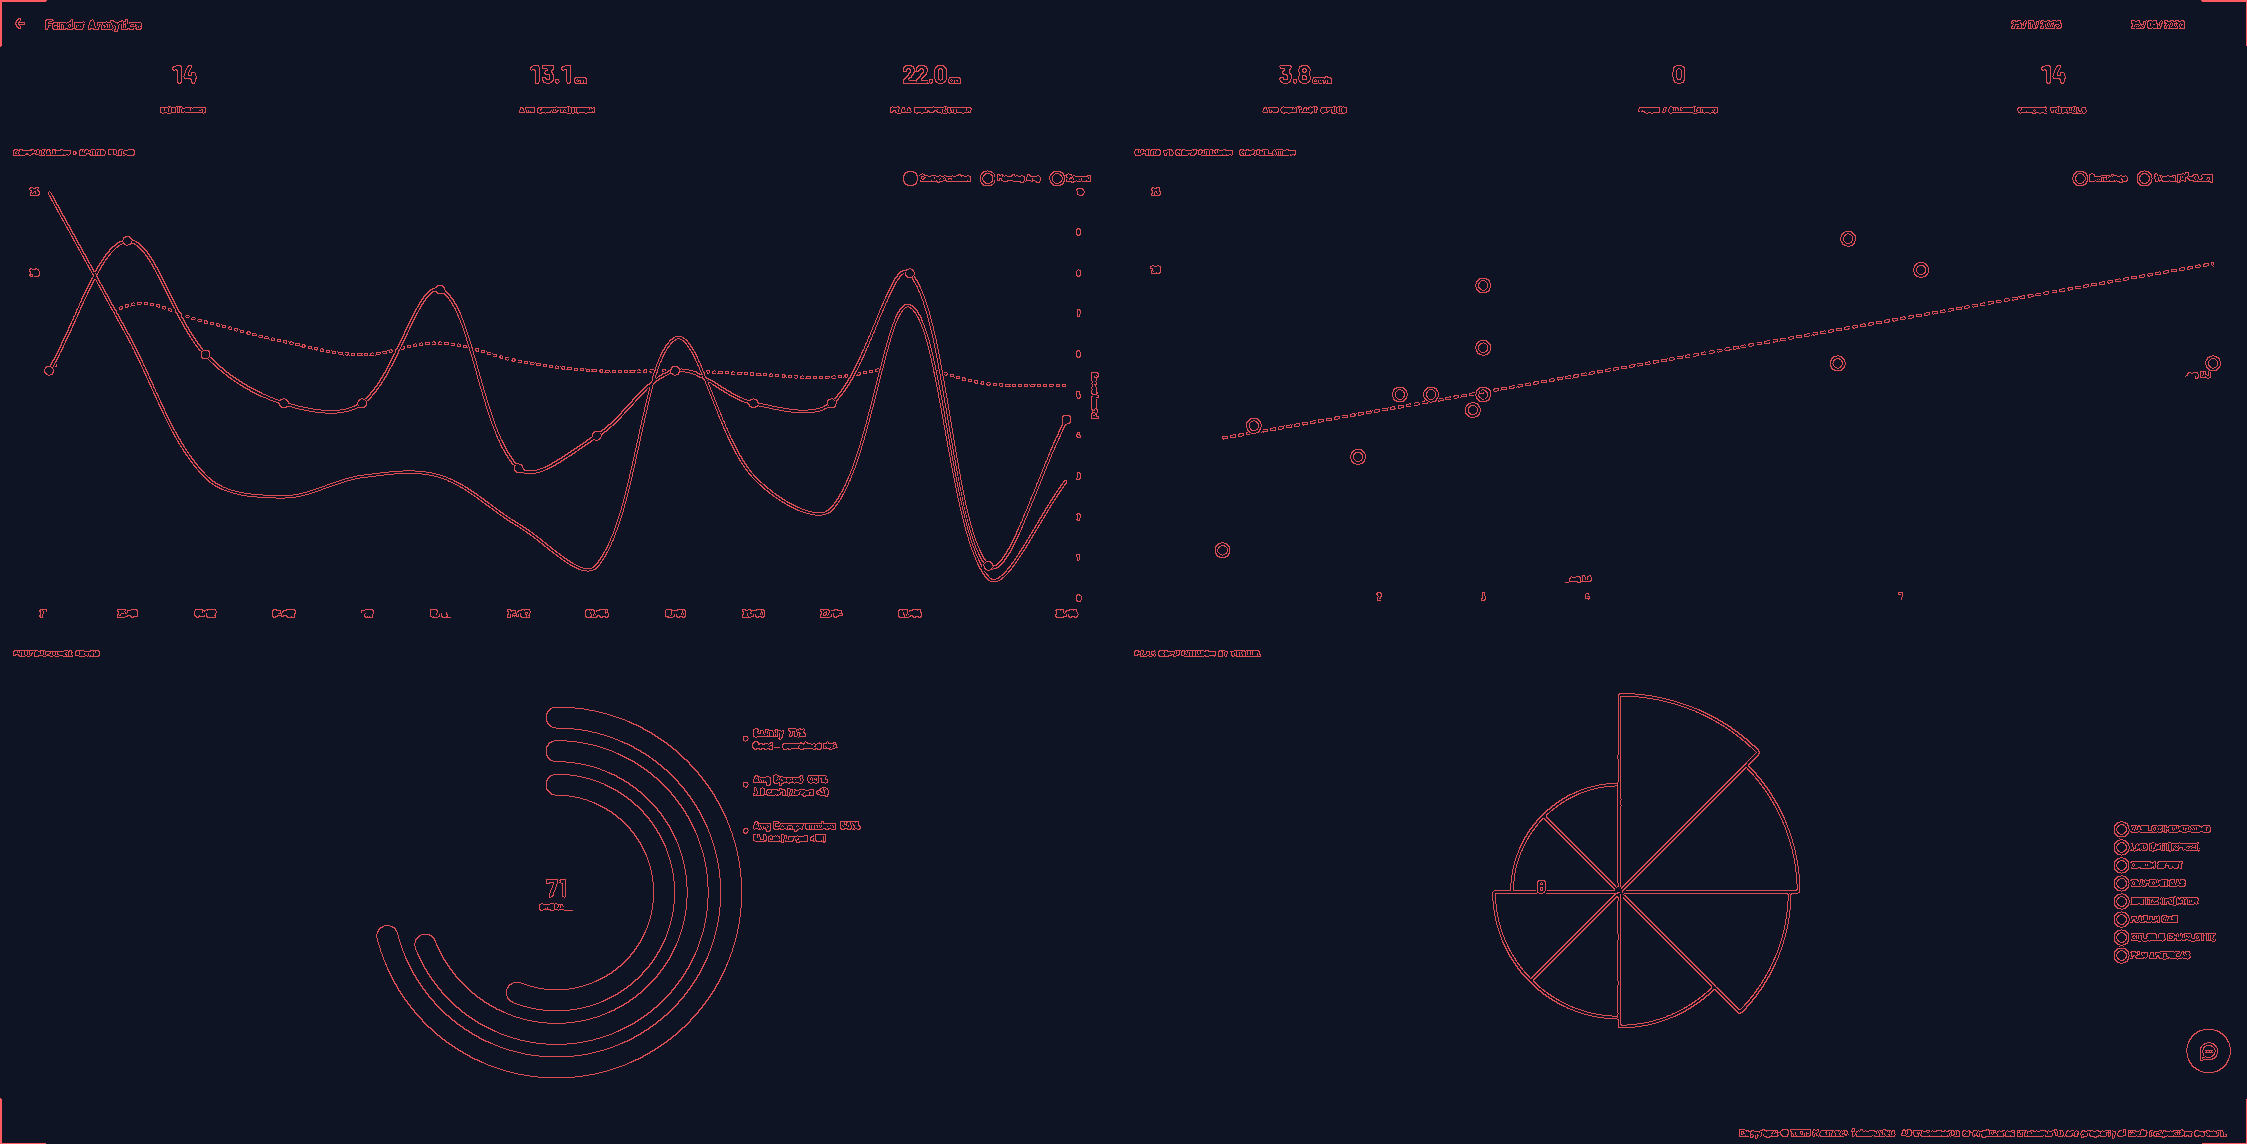
Wireframe-treated Navitrak Fender Analytics dashboard — force/compression traces, speed-vs-compression scatter, composite safety scoring ring, and per-vessel peak compression polar chart.
FENDER ANALYTICS · WIREFRAME-TREATED OPERATIONAL RECORD
3.A · engineering reference · SPEED VS COMPRESSION

Scatter + safety zones

SAFETY ZONE · engineering reference v (cm/s) δ (%) FLAG
3.B · PER-VESSEL TREND · PEAK COMPRESSION

Per-vessel polar chart

90% 30% vessel A vessel B

FIG. 3.1 · Real Fender Analytics dashboard, wireframe-treated (Canny edge detection → coral on navy). All identifiers abstracted; no vessel names, pilot names, or customer marks survive the transform. The two inset charts illustrate the evidence-linked analytics: speed-vs-compression scatter (3.A) and per-vessel peak compression polar (3.B).

§04 / DEFLECTION CURVE

A datasheet curve becomes a runtime model.

Every fender ships with a manufacturer deflection curve — reaction force versus deflection percentage, with rated values at known points. Navitrak loads the curve as a runtime physics model so every laser distance reading produces an instantaneous force estimate, scored against the same rated points.

§05 / EVIDENCE ALIGNMENT

Direct, evidenced alignment.

Four physics-layer capabilities, four evidence rows from the engineering framework. FULL and PARTIAL scope indicate coverage depth.

01
Per-fender datasheet-driven force / energy / % rated calculation (runtime physics model from manufacturer deflection curves). Continuous runtime computation with rated-vs-actual comparison, surfaced per fender on every Operation Report.
Per-fender runtime physics model Rated-margin evidence trail
FULL
02
Speed vs compression correlation analytics across berthings. Visualised in the Fender Analytics dashboard with safety zones and trend fit trend across the operational record.
Speed/compression trend analytics
FULL
03
Composite per-berthing safety scoring. Numerically scored per event; methodology configurable per site.
Composite safety-scoring method
PARTIAL
04
Per-vessel peak compression tracking across visits. Polar / radial chart per unique vessel across the operational window.
Per-vessel compression history
FULL
■ POSITIONING · CATEGORY A COUNTER-PITCH

"They sell fenders.
We model them."

A hardware vendor's spec sheet ends where their fender ships. Ours begins there. Navitrak loads the manufacturer's deflection curve as a runtime physics model and tells you, every second of every berthing, what reaction force that fender is absorbing relative to its rated capacity — then aggregates the result across vessels and months into a physics-aligned safety scorecard.

The hardware vendor sold you the steel. We tell you what the steel is doing.

VERBATIM · brief/04-positioning.md §5 Category A
■ TENDER-READY DOCUMENT

The capability-level Vendor-Agnostic Reference Specification.

An EPC spec writer should be able to download it, lift sections directly into a tender's functional specification chapter, and produce a defensible 2026 BAS+VTMS spec — without writing it from scratch. Email-gated, free, annual revision cadence.